Add back ABCD on the graph
We received feedback from our client in teaching the new PI2 workshop that they NEED the ABCD back on the graphs. Both from teaching and learning being able to understand which dot is which.
Comments: 7
Oldest
•
Newest
•
Most likes
•
Fewest likes
-
06 Mar, '25
Becca VanDerveerHighlighted comment
Can we reopen and not mark as done as this is still not visible in the software itself--only in downloaded reports. Having to take the extra step of download each time is adding significant wasted time to trainings and consulting calls. -
19 Jun, '24
Angie Friel MergedPlease add the factors back to the pattern graphic. We understand it is an aesthetics but it would be helpful.
This is from the entire Six 20 Partners team!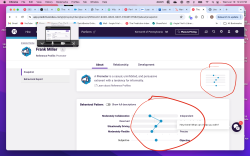
-
31 Jul, '24
ClaytonIf it is still referred to as ABCD and E in the training, workbooks, and other resources/materials, it should be displayed on the graphs in the software.
-
14 Oct, '24
Sarah Mulvey System"Factors on the pattern" (suggested by <Hidden> on 2024-06-19), including upvotes (9) and comments (0), was merged into this suggestion.
-
15 Nov, '24
Fred Henselhaving used this on and off for over 30 years, i need the full graph to quickly and easily assess candidates. we have a very small company and don't have time to spend reviewing such a large amount of detail and need the quick snapshot. loss of this graph is a deal breaker as it makes the software useless to us.
also, having the older method of ranking with the actual numbers in the past, is much better than the most recent variation. just how can you get a 2 sigma deviation with only providing 3 to 5 data points? we have made a couple bad hires that the older, classic graph layout, could have prevented. also, i saw the shift left and right to be highly accurate (scarily accurate) in morale issues. since we are a small company, i have practiced with this on friends and family with very interesting results. -
17 Dec, '24
Karman HotchkissSeeing the pattern is critical to how I use PI. It helps me as a coach and as a leader, and is really the key reason I use PI at all.
-
05 Mar, '25
Sarah Mulvey AdminMarked as "done" as the new BA report PDFs now have graphs with factor labels and detailed sigma lines. The rest of the graphs in the PI2 software and all Hire and Inspire downloads will also be updated with graphs that match this new format in Q2 2025.
